Remittances and poverty from a gender perspective
Thesending, distribution and use of remittances is not only determined by the economic context and the market, but also by the situation of material poverty of the families receiving them and the power relations established inside their homes, especially the gender relations, which involve different behaviours and in the way women and men act.

Foto: Jorge Luis Baños
On the other side of the sea those beloved beings
Will sit at the table trying not to look at
The place which used to be yours
One less mouth to feed
Does not make up for the void your absence left
Nadine Sarreal, Philippine poetess
The gender perspective modifies and notably enrichesthe debate on remittances and poverty and allows for going beyond a discourse that reduces them to the discussion of their potential to revitalise consumption or productive investment within a mercantile monetary logic. The majority of the economic research does not take into account the amount of money sent by migrant persons, how that money is sent and used are determined not only by the market economy, but also by the political economy of the home and the relations of power.
The aim of this study is to assess the effects of remittances in poor homes of a territory of the Cuban capital in order to explain if there are unequal behaviours and if they are associated to gender factors. The People’s Council of Santa Fe, in the municipality of Playa in Havana, was chosen for this, a territory which, despite the territorial policies with an integral focus and having a more favourable situation than other territories, has not been able to resolve the urban poverty that still exists there.
Basedon surveys and interviews, the incidence of the gender factors in the remittances is analysed and its unequal consequences for men and women in poor homes that receive them is made visible. The privation of the families studied was characterised and the socioeconomic profiles of the migrant persons of the homes receiving remittances and the gender inequalities inside those family units were determined. Moreover, the relation of those factors to the material poverty of the chosen families and the way in which women and men face it is explained.
Santa Fe and its population
The People’s Council of Santa Fe, in the Cuban capital’s Playa municipality, borders to the north with the waters of the Straits of Florida, to the east with the People’s Council ofJaimanitas, to the west with the town of Baracoa and to the south with the town ofCangrejeras, Bauta municipality. It has a total of 27,855 inhabitants and a density of 2,812 inhabitants perkm2;it has a territorial extension of 8.2 km2 and is divided into 12 districts.
It is a locality of fishing origin, which many describe as a peri-urban town. Probably because of its historical and physical separation from Havana it cannot be considered, among the definitions of community, as a barrio or town. However, neither does it totally cover a rural zone.
On the other hand, Santa Fe was considered for a long time as a problematic place from the political point of view, among other aspects as a result of having been used for a long time by the country’s emigrants as the base for illegal exits by sea.The so-called rafters’ crisis in the 1990s had this localityas a scenario where daily exits from the country by persons who put at risk their lives.
Its people have been transformed as a result of the demographic changes caused by the high external and domestic emigration (especially from the eastern provinces toward the country’s capital). In 2012 the population residing in Santa Fe revealed a higher amount of women(14,401) than of men (13,454), it is relatively young and the majority of the persons is concentrated in the age group of 25 to 59 years (39 %), while the population aged between 60 and 64 remains below the national average (11 %).
With an economy mainly of services, the territory has diverse commercial establishments, important tourist centres and especially the nearby Latin American School of Medicine (ELAM), which gives a great boost to that locality’s self-employment activity.
The Council presents serious problems with the deficient state of the sewage system and the constant floods caused by the deficient drainage of the streets, together with the proliferation of rubble and garbage accumulated which is not picked up periodically by the local authorities responsible for maintaining the cleanliness of the territory.
The deterioration of the housing fund is also a serious problem in the municipality and also for the Council, where one can find a great deal of dwellings and state-run establishments (like schools, health centres) in a bad construction state. Moreover, due to its coastal location, it is highly vulnerable to a series of extreme climate phenomena like hurricanes, which endanger a great many poor families and their homes.
Profile of chosen homes
Though the studies on poverty have not been given continuity in the more recent years, we do have the research by Sandoval[i], whose estimate for the food basket is 420.00 pesos (20 USD) and the relation between food expenses and total consumption expenses define the poverty line in Cuba in 841.40 pesos. All this marked by the fact that in 2012 the inflation rate was higher than in 2011 (1.9 % and 1.3 %, respectively) and it is forecasted that for 2013 the inflation will be higher than the previous year.
The first thing that calls attention when assessing the per capita incomes (discounting incomes from remittances), is that all (50) the homes in this study are below that line. Of the homes in this study 94 percent (47) have per capita incomes of 420.00 pesos and less, barely being able to cover the basic food basket.This reveals the conditions of poverty of incomes and the vulnerability that characterises these homes and what receiving remittances means for them.
Per capita chart in national currency according to scales
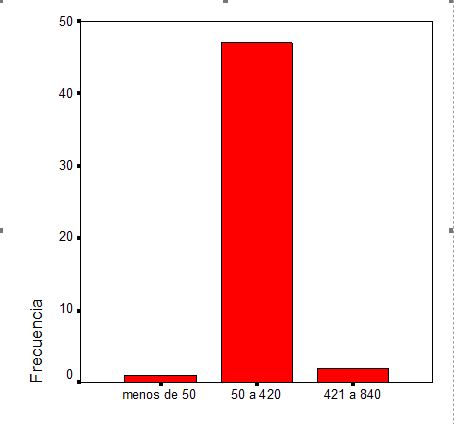
Frequency
less than 50 50 to 420 421 to 840
Per capita in national currency according to scales
Out of a total of 182 persons, 56 per cent (102) do not have their own incomes. The majority of the surveyed homes are in the second scale of incomes. One of the factors bearing a weight on the low incomes of these families is the charge of dependents (less than 5 years old, students, unemployed and women homeworkers). The following table collects the occupational structure of the members of the families.
Table 1
Distribution of the occupations of family members
| Frequency | Percentage | ||
| Valid | Blue collar worker | 4 | 2.2 |
| Technician | 7 | 3.8 | |
| Management | 1 | 0.5 | |
| Services | 30 | 16.5 | |
| Non-remunerated homeworkers | 24 | 13.2 | |
| Unemployed | 20 | 11.0 | |
| Self-employed | 9 | 4.9 | |
| Pensioner | 18 | 9.9 | |
| Student | 39 | 21.4 | |
| Professional | 11 | 6.0 | |
| Aged less than five | 18 | 9.9 | |
| Handicapped | 1 | 0.5 | |
| Total | 182 | 100.0 | |
Source: Drawn up by the author based on the data from the home survey[1]
One can infer from the table that, among the occupations of the members of the families who contribute incomes, those with the largest amount of employed persons are the service workers (16.5%), a low income category. The number of self-employed (4.9%) is higher than other occupations in the state sector, like the blue collar workers and technicians, which is a sign of the relaxation of the regulations for non-state work in the country.
The highest figure is among the students, 21.4 per cent, and also the women homeworkers,[2]who represent 13.2 per cent. Among the latter, four carry out informal work, whose monthly incomes were declared by them, but these incomes are very unstable and low.
The analysis of the structure of the source of incomes also reveals information about the occupations that have a greater weight in the formation of incomes in the homes and, somehow, explain their precariousness. In 72 per cent of the homes (36)the incomes are in national currency (CUP), followed by informal work in 56 per cent (28), pensions in 34 per cent (17), other incomes in convertible currency (CUC[3]) through state-run businesses represent 28 per cent (14) and private work, 10 per cent (11).
In the country’s current conditions, having a source of hard currency substantially defines the living conditions for a Cuban family. An income with certain stability is decisive to cover the food basket and other essential expenses for the reproduction of daily life, including medicines, transport, among others.
The structure of the average expenses of these families is collected in the following table.
Table 2
Structure of the expenses declared by the families according to type
| Types of expenses | Total ofHomes | Minimum | Maximum | Average |
| Rent | 3 | 20.00 | 87.00 | 44.6667 |
| Electricity | 50 | 7.00 | 350.00 | 62.0600 |
| Telephone | 41 | 7.00 | 810.00 | 175.7317 |
| Gas | 50 | 7.00 | 100.00 | 22.9600 |
| Water and sewage | 50 | 1.00 | 100.00 | 12.9400 |
| Total expenses for general services | 50 | 28.00 | 910.00 | 244.8200 |
| Total expenses for food | 50 | 370.00 | 4,000.00 | 1710.7000 |
| Expenses in rationed market | 50 | 20.00 | 100.00 | 54.9000 |
| Expenses in liberated market in CUP | 50 | 20.00 | 2,000.00 | 359.2000 |
| Expenses in convertible peso (CUC) market | 50 | 10.00 | 120.00 | 41.3000 |
| Expenses in black market | 45 | 30.00 | 1,250.00 | 339.7778 |
| Total of all the month’s expenses | 50 | 422.00 | 4,288.00 | 1955.5200 |
The majority of these families have the benefit of having their housing in free usufruct and, therefore, only three declared they paid rent, which determines that the amount of housing expenses is lower. Another low expense is the one for the payment of all the services: water, gas, electricity and telephone bills. The majority of the homes have a landline telephone.
The highest percentage of these families’ monthly expenses is concentrated in food, the average per capita expenses for food is 1,710 pesos and the per capita expenses for everything is 1,955 pesos. By market segments one can observe that the expenses in the rationed market are lower (the amount of the offered rationed products has been reduced), while the expenses in the liberated market in CUP and in the black market has a greater weight, since many Cuban families typically resort to it, taking into account the high prices in the market that sells in hard currency (CUC).
In the majority of the families, 64 per cent (32), the amount of incomes declared was below the expenses, while 34 per cent (17) spends less than their incomes. It must be taken into account that some members of these families frequently carries out informal work to be able to cover their expenses and all of them are not always willing to declare the total amount of their monthly incomes. On occasions they do not control them, since it involves unstable work, risky and does not represent much income; what was declared is almost always the stable income.
Another of these homes’ privations has to do with the construction quality of their homes. The majority live in houses (82 %), while the rest of the families live in apartments, improvised dwellings or a room in a tenement house; but the construction state of the buildings oscillates between regular (68 %) and bad (22 %). With the limitations of the incomes, it is difficult to make important repairs if they do not have additional incomes.
Even when almost all the homes have the bathroom inside the dwelling (87.5 %), that does not mean they have resolved the sanitary problem.
In the buildings where these families live there are home connections for access to waterin 86 per cent of the cases (43), three do not have plumbing pipes (6%) and five have to carry water (8%). But, since water is available during limited schedules, it is necessary to store it and almost all of them have been forced to make investments to install tanks inside the home, on a small rooftop or in the hallway; that is, in a disorganised way.
The environmental problems are seen in the unclean streets due to the accumulation of rubble from construction work and the instability in the garbage collection by the municipal authorities, in turn leading to focus points of the aedesaegyptimosquito and cases of dengue are persistently present.
A trait of the surveyed families is that they show, in the first place, a greater percentage of homes with women household heads (38) and, in second place, the incidence of single parent homes (with a female or male household head) and an extensive single parent family. It was found in the fieldwork that single parent homes with female household heads predominated.
Another of the characteristics of the poor families is the lack of liquid and fixed assets: 98 per cent does not have a savings bank account; all of them say that no member of their family has another dwelling or plot of land; 82 per cent does not own a private business and 87.5 per cent does not have a means of transport (those who declared to have one were referring to a bicycle).
The situation with the possession of domestic goods is not as bad as that of the other assets and housing. In terms of electrical appliances it is distributed in the following way:
Table 3
Distribution of electrical appliances essential for daily life
| Types of Goods | Total ofHomes | Percentage |
| Refrigerator | 50 | 100 |
| Colour TV | 49 | 98 |
| Fan | 49 | 98 |
| Iron | 45 | 90 |
| Washing machine | 45 | 90 |
| Blender | 40 | 80 |
| Video | 38 | 76 |
| Electric cooker | 33 | 66 |
| Cell phone | 32 | 64 |
| Telephone | 28 | 56 |
| Computer | 14 | 28 |
| Recorder | 9 | 18 |
| Radio | 8 | 16 |
| Sewing machine | 8 | 16 |
| Microwave | 7 | 14 |
| Electric range | 5 | 10 |
| Record player | 4 | 8 |
| AC | 2 | 4 |
| Motor transport | 3 | 6 |
As can be seen, the possession of essential goods is high, in some families there are even several, like recorders, computers, DVDs and blenders, among others.
This better situation is due, on the one hand, to the replacement of high energy consumingelectrical appliances with energy-saving ones carried out massively in the country as part of the National Energy Programme and which included payment facilities for the population. Others have been purchased through the remittances in kind (cell phones, computers).
Regarding education, the main part of the school age population has finished senior high, 38.5 per cent (70) and 18.1 per cent junior high; they are followed by the university graduates, with 10.4 per cent (19). Even though they are not low educational levels, we mustn’t forget that the situation of “inverted social pyramid” that characterises the countrydoes not guarantee that higher levels of education translate into better incomes.
It is interesting that, when exploring in the surveys the perception they have about their living conditions, 80 per cent considered it acceptable, while 14 per cent recognises it as poor.They all coincide in declaring that the remittances are fundamental since without them they would be in a critical situation and they allow them to meet their basic needs(food, clothing), but are not sufficient for other expenses like repairing their homesor for some type of productive investment.
“Acceptable, thanks to the aid I receive, even though I haven’t been able to repair the kitchen and the bathroom because the work I have to do is very expensive, there’s still a great deal missing for it to be comfortable.” (Female household head, interviewed woman)
“Acceptable, because we have a plate of food every day and we have made home improvements, since we are repairing it.” (Male household head, interviewed woman)
The homes described here have diverse shortages in indicators that define their standard of living: poor incomes (excluding remittances), problems with the home’s quality, the majority of the families to not have liquid and fixed assets that allow for economic sustainability in the long term.
In this sense it is necessary to analyse the profile of the migrants.
What is the socio-demographic profile of the migrant persons of the People’s Council?
Following are the socio-demographic characteristics of the migrant at the moment of emigration:
- Sex. 57.9 per cent of the sample of migrants corresponds to men, though the number of women (24 / 42.1 per cent) is also significant.
- Age.The two age groups that prevail are: 25-29 years, with 22.8 per cent,and 20-24 years, with 15.8 per cent.
- Race.Whites are 64.9 per cent; mestizos, 24.6 per cent;and blacks, 10.5 per cent. That order of the structure in percentage also characterises the Cuban emigration on a national level, which is mainly white.
- Marital status.At the moment ofemigrating, 68.4 per cent were married, 24.6 per cent single and the majority did not have children (49.8 %).
- Relationship of those who emigrated in relation to the household head. The children prevail (21.1 %) and brothers and sisters (19.3 %).
- Educationallevel.The majority had finished senior high (61.4 %) and secondary level (19.3 %)and a few had a university level.
The male majority in the group of migrants is related to the stage in which these migrations took place. Sources from the Centre for International Migrations Studies of the University of Havana say thatthe second most important negative external migratory total took place since 1959 in the period from 1995 to 2005.[4]
The great majority of migrant persons from the surveyed homes used legal means to emigrate (82.5 per cent /47), while only 17.5 per cent (all men) resorted to illegal emigration by sea.
Out of the 50 surveyed families, 51 said they received remittances, since in one case two members of the same family received them. Women are the majority among the receivers (86.3 per cent / 44). Out of the receivers of remittances 80.3 per cent are female and male household heads. The survey reveals that the majority of the remittances’ beneficiaries (25.5%) are aged between 60 and more, followed by the 40-44 age group, closely related with the receiving and sending of remittances pattern.
Another important aspect of the receivers lies in their educational level. A bit over half (52.9%) has finished senior high and nine affirm they have a university diploma.
Receiving and sending of remittances pattern
The following sending patterns were found in the interviewed homes:
- Sons and daughters who send to their fathers and mothers:they do so on a regular basis to guarantee the subsistence of homes of senior citizens who are alone or who do not have sufficient resources (pensioners and housewives); as well as adults who live with handicapped sons and daughters or are in charge of many dependent children, in homes in which several generations live together. These cases include several sons and daughters in the United States who alternate and complement the sending of remittances.
- Sending between siblings: they tend to be lesser amounts and in several cases appear with the ingredient of being a loan for investments in businesses co-managed by brothers or sisters. In several cases remittances are sent to sisters who are responsible for the care of their sick parents.These sisters who manage the money sent to their parents also receive remittances from their brothers or sisters, but in lesser amounts.
Though the countries receiving Cuban migrants have been diversified, the major part of the emigrants of the interviewed homes resides in the United States (see table).
Table 4: Country of residence
| Frequency | Percentage | ||
| United States | 38 | 66.7 | |
| Spain | 5 | 8.8 | |
| Latin American country | 10 | 17.5 | |
| Turkey | 2 | 3.5 | |
| Canada | 1 | 1.8 | |
| Germany | 1 | 1.8 | |
| Total | 57 | 100.0 | |
The amounts reported by the interviewed persons account for relatively low quantities, which range from 10 to 500 dollars. The mean average valueof the homes is 111 CUC.
Table 5
Average value of remittances
| N | Minimum | Maximum | Average | |
| Average value of remittance | 50 | 20.00 | 300.00 | 111.2000 |
| Lowest value of remittance | 50 | 10.00 | 200.00 | 61.9000 |
| Highest value of remittance | 50 | 20.00 | 500.00 | 143.4000 |
| N valid (according to list) | 50 |
The families receiving remittances highlight that the amounts they receive have decreased compared to previous periods. The explanation they have for the phenomenon has as substratum: the presence of marriages of sons and daughters, an increase in the payment of taxes, the cost of housing and living, labour instability and greater economic difficulties. The economic crisis that was already affecting the United States and the countries of the euro zone during the study’s moment (June 2013) is expressed in these elements.
Another change that is highlighted is the decrease in the frequency of the sending of remittances. While before they were sent regularly and constantly every month, in several cases it stands out that the sending of remittances has decreased to twice a year, every three months or occasionally.
Inflation in Cuba is added to the economic problems affecting families in the United States and Europe, which reduce the impact of the remittances. The receiving families underline that the remittances previously had a greater impact in their living conditions and this impact has decreased due to the inflation.
During Christmas, special days like mother’s and father’s day, special remittances are sent to sons and daughters, fathers and mothers, brothers and sisters. These special remittances oscillate between 50 and 200 dollars, depending on the family relationship; in the case of fathers and mothers and sons and daughters, the amounts are higher.
It is interesting that, when the per capita income without remittances is compared to when remittances are included, one observes that in 92 per cent of the homes there is a movement on the scale. This reflects the following.
Table 6
Scale of incomes when remittances are added.
| Frequency | Percentage | ||
| 50 to 420 | 4 | 8.0 | |
| 421 to 840 | 19 | 38.0 | |
| 841 to 1,840 | 23 | 46.0 | |
| more than 1,840 | 4 | 8.0 | |
| Total | 50 | 100.0 | |
How remittances are used
As previously seen, the amount of remittances is low and barely covers food needs, which is why the receiving home does not havemany options to diversify their use, thus giving priority to these needs. One of these families’ principal incomes is the remittances, thus the fact that their use is mainly devoted to purchasing food.
Taking into account the dwellings’ construction state, a part of the remittances is also set aside to improve the houses (see photos). During the survey it became evident that the new or renovated homes belong to families receiving remittances or having successful businesses.
There is a very low incidence of remittances devoted to savings or investment. The difficulties that the families receiving remittances havefor saving have to do with the fact that the amounts received are small and they are principally used to make up for food expenses. There were no luxury objects or sumptuary goods. Some persons receiving remittances affirmed that the migrants had given a small proportion of money for the purchase of vehicles, as is the case of a receiving woman whose ex-husband sent her money to buy a bicycle taxi.
Remittances in kind
In the homes receiving remittances there were remittances in kind, principally clothing and footwear, electrical appliances, furniture and household equipment, mainly washing machines, TV sets, DVDs, irons, electric ovens.
The economic crisis in the United States and Spain, the migrant population’s difficulties in finding jobsand the increase of their family commitments have a notableon influence this. A type remittance in kind that stands out is: the sending of clothing to sell. This pattern of remittances in kind guarantees some small incomes in the informal economy that enables another source of incomes; it mainly takes place between sisters.
Table 7
Types of products received as remittances
| Products | Total ofhomes | % compared to total of homes |
| Food | 14 | 28 |
| Clothing and Footwear | 34 | 68 |
| Toiletries | 8 | 16 |
| Medicine | 12 | 24 |
| For home repairs | 1 | 2 |
| Electrical appliances | 4 | 8 |
| School supplies | 1 | 2 |
| None | 12 | 24 |
What differences exist between homes headed by men and women, and inside them?
In the construction process of the sample the aim was to maintain a similar quota for female and male household heads, but it was absolutely impossible to achieve this in an exact way for two reasons: 1) the female population of the territory exceeds that of the male, a fact that also happens with respect to household heads (38). The first inequality detected is in the incomes: the homes headed by women are more represented in the lowest stratum (23), in which they barely cover the basic food basket, while only seven homes headed by men were in that stratum.
The table, which illustrates the occupational structure for each type of home according to the household head’s sex, expresses very clearly where those members who have the occupations that contribute the most incomes live.
Table 8
Distribution of the population’s occupational categories according to household heads.
| Occupational categories of the members of the home | Home with a female household head T % | Home with a male household headT % | Totals
T % |
| Blue collar worker | 1 50 | 1 50 | 2 100 |
| Technician | 4 80 | 1 20 | 5 100 |
| Service | 5 62.5 | 3 37.5 | 8 100 |
| Homeworker | 14 100 | 0 0 | 14 100 |
| Unemployed | 2 100 | 0 0 | 2 100 |
| Self-employed | 2 66.6 | 1 33.3 | 3 100 |
| Pensioners | 7 70 | 3 30 | 10 100 |
| Professional | 3 60 | 2 40 | 5 100 |
| Total | 38 | 11 | 49 100 |
The occupations that prevail in the lowest income stratum are the workers in services and pensioners. The first is the most represented in the homes headed by women.In the case of the pensioners, the incomes of all those who make up those homes are located in the low stratum, while in the homes headed by men they are in the higher stratum.
In the surveyed homes women are the majority of the receivers of remittances, control them and decide on what they will be spent. Regarding the structure of the spending of the remittances, it was seen that women prioritise food and the wellbeing of their children and husbands. The most constant perception is that the men do not have access to or spend the remittances, but the second is that, when they do, they prioritise their personal expenses. The toiletries are their toiletries, not that of the home, it is their clothing and footwear. For the men, the bulk of the expenses are concentrated in smoking and drinking (see table).
Table 9
Perception on the behaviour of the structure of the spending of remittances according to products consumed by the women and men in the home.
| Types of products purchased | WomenTotal % | MenTotal % |
| Food | 47 94 | 5 10 |
| Toiletries | 19 38 | 2 4 |
| Clothing and footwear | 16 32 | 6 12 |
| Investments in the dwelling | 13 26 | 5 10 |
| Medicines | 4 8 | 0 |
| Electrical appliances | 4 8 | 1 2 |
| Home equipment | 4 8 | 0 |
| School supplies | 1 2 | 0 |
| Smoking | 1 2 | 7 14 |
| Alcoholic beverages | 1 2 | 8 16 |
| Hairdressing supplies | 1 2 | 0 |
| Private teachers | 1 2 | 0 |
| Maid | 1 2 | 0 |
| Motor transport | 0 | 1 2 |
| Cell phone | 0 | 3 6 |
| Computer parts | 0 | 1 2 |
| Blacksmith’s supplies | 0 | 1 2 |
| Gym | 0 | 1 2 |
| Do not have access | 0 | 25 50 |
The inequalities become acute because the women bear the brunt of all the domestic activities and, in particular, are the ones who carry out the tasks related to cooking, the hygiene of the food products and their purchase.
In 84 per cent of the homes the women are the ones who cook and this task is only shared by the women and men in eight per cent of the cases.In 82 per cent the women are the ones who wash dishes and this task is shared by the women and men in 14 per cent of the homes.The men participate the most in taking out the garbage, buying bread and, in third place, in making the purchase, since the shortages and the problems with availability in the market force the families to carry out this activity in a more collective way and building very diverse strategies in the seeking for food and other basic items for the home. However, even during the process of purchasing, women contribute the most:in 66 per cent of the homes they are the ones who do this, in 10 per cent the activity is shared and in 24 per cent only the men carry it out.
Table 10
Who does the housework
| Housework | WomenT % | MenT % | SharedT % |
| Cooking | 42 84 | 4 8 | 4 8 |
| Washing dishes | 41 82 | 2 4 | 7 14 |
| Cleaning | 47 94 | 3 6 | 0 0 |
| Taking out the garbage | 15 30 | 33 66 | 2 4 |
| Going to the market | 33 66 | 12 24 | 5 10 |
| Getting bread | 21 42 | 28 56 | 1 2 |
| Washing | 47 94 | 2 4 | 1 2 |
| Ironing | 47 94 | 2 4 | 1 2 |
| Carrying water | 11 22 | 17 34 | 0 0 |
| Home electrical, carpentry and building repairs | 13 26 | 36 72 | 1 2 |
| Paying the bills | 34 68 | 10 20 | 6 12 |
| Caring for the sick | 30 60 | 0 0 | 2 4 |
| Caring for children | 27 54 | 0 0 | 3 6 |
Women’s excess work load is related to housework, which also takes place inside the homes headed by men and covers all the activities, not just the ones mentioned.
The possession of household goods favours them in all the homes, in the sense that they are owners in the majority of the cases, which can be explained because they are all household appliances.
In the table one can perceive the asymmetry in women’s participation in all the household activities of the homes headed by women, thoughit is emphasized in those conceived as traditional for the women. But the sexist division of the chores is also seen in the families headed by men, as is confirmed in the majority of the percentages of women’s participation in daily chores. All these inequalities are an expression of the prevailing patriarchal culture in all the families, which explains the bigger non-remunerated work loadof the women household heads and of the women living in homes headed by men.
In all aspects, they bear the brunt of the decisions in these homes, which in their majority are headed by them, but this does not mean that women’s weight in the distribution and housework is reduced.
Table 11: Structure of decisions according to sex
| Type of Decisions | WomenT % | MenT % | Shared by men and womenT % | Total % |
| How is the housework distributed? | 44 88 | 2 4 | 4 8 | 50 100 |
| How is the money distributed for expenditures? | 37 74 | 7 14 | 6 12 | 50 100 |
| What has to be bought for consumption? | 41 82 | 4 8 | 5 10 | 50 100 |
| How to educate the children? | 26 52 | 1 2 | 11 22 | 38 76 |
| What is repaired in the home? | 30 60 | 16 32 | 4 8 | 50 100 |
| How is daily coexistence organised? | 33 66 | 1 2 | 16 32 | 50 100 |
| How is the remittance distributed and in what? | 39 78 | 7 14 | 4 8 | 50 100 |
With respect to the homes that did not declare a distribution of the decisions regarding the education of the children, it is because there are no children in the home.
The time women dedicate to their homes – be it as household headsor not, working only at home or sharing other activities not involving the home – makes them the owners par excellence of their spaces and, therefore, the ones who receive the greatest impact from the problems inside the family, of shortages and the daily pressures on their physical and emotional health. This reality determines that women suffer and feel more the poverty than the men.
When the surveyed families were asked to evaluate who lives the worst situation, in all cases women are mentioned. It is true that they are the majority as household heads, but even the surveyed men recognise that the women live the worst situation. And none of the cases mentions only the men.
Men are not interested in anything, just having food and comforts; women bear the brunt of the house (woman head of household, interviewed woman)
Women are the ones who are most concerned that nothing runs out in the house and the ones who most suffer because of the shortages, especially when this involves the young people, which on many occasions do not meet their expectations and the sick because of the shortage of medicines. My father died of cancer and, if it hadn’t been for the aid my aunt gave us, I don’t know how we would have been able to cope with the hospital, transportation and food; luckily he lacked nothing (woman head of household, interviewed woman)
Women, because we have more expenses than men, everything is expensive and on occasions one has to do tricks to make do with the money we have (male head of household, interviewed woman)
The study in the People’s Council of Santa Fe revealed the economic vulnerability that characterises in general the poor homes receivers of remittances, especially the homes of female household heads. The excessive dependence on the remittances by poor homes causes that, in case the remittances decrease or stop, these homes will be placed on the scale of low incomes, with the homes with a female household head being affected the most, placing them on the scales of lower incomes.
The weight of food products on the expensesof homes receiving remittances is very high and, above all, in those homes that have a greater number of dependants, children less than five years old, students and senior citizens,which implies greater expenses on food and the purchase of medicines.
It is understood that the women household heads live situations of greater vulnerability because they are, in their majority, non-remunerated homeworkers, are concentrated in sectors with less incomes than in the case of men. In general, women display higher educational levels with respect to men, but this has not translated into better economic opportunitiesand labour insertion.
Women live situations of empowerment and disempowerment in the poor homes receiving remittances.Depending on and managing the remittances does not suppose deciding on their use; the women who receive remittances do not always have the decision-making capacity on their use, which is frequently defined by the person who sends them. The power of negotiation and decision making in the home does not take place automatically.
The distinction between access and control is very important in terms of gender, since the capacity to use something does not necessarily imply being able to decide on what the resource will be used and its effective benefit.
Remittances act as a substitute for the income which women do not have or that is insufficient to meet their basic needs.In this way, they can have better working conditions in the home, but the global weight of the work increases (remunerated and non-remunerated) and their position within the sexual division of the work at home does not change, they continue being the caretakers and those responsible par excellence of non-remunerated housework.
With respect to the reduced productive investments that women make with the remittances, the study revealed the differences with respect to the investments made by men:
- Investments made by women are very small and were made in businesses considered “feminine,” like hairdressing and the sale of clothing, video films and accessories. While the men are taxi drivers, breed animals.
- Women generally almost always work in the state services sector or at home and do not have a previous businessand tax culture.
- They have small sums of money available to invest (the major part is devoted to consumption) and the businesses are backed to a great extent on the work of non-remunerated relatives, with a very small capacity to generate employment.
- They are characterised for their low profitability and their sustainability difficultiesin the mid and long term (a high mortality of the productive ventures).
On the other hand, the ventures the homes undertake with the remittances cannot overcome the strong structural conditions suffered by the communities of origin of the migrant persons: infrastructure problems, the domestic markets’ weakness, the instability of the necessary supplies for the functioning of the ventures, among others.
The results of these studies report in general that women invest long days in non-remunerated work, among them housework, caring for children and the sick, and community work. These data allow for supporting the hypothesis that women’s high exposition to non-remunerated workmakes it difficult for them to participate on an equal footing in the remunerated work. More so, it increases their vulnerability to enter or remain in situations of impoverishment. (2015)
[1] All the tables of this epigraph are drawn up by the author based on data from the home survey.
2 Commonly called housewife. Here we simply want to recognise that she is a worker, even if she is not paid for it.
3 In 1994 the Central Bank of Cuba replaced all the U.S. dollars with convertible pesos. The three currencies circulated until October 2004. In March 2011 the CUC was devaluated and was equalled to the dollar, but it maintained the 10 per cent tax.
[4] The most significant rates of the external migration total are for 2004. This directly responds to the putting into practice of the 1994-1995 Migration Agreement between the United States and Cuba, especially due to the granting of visas to Cuban citizens to emigrate to that country (Aja, A and López C, 2009).
[i]Sandoval, Raúl:La pobreza en Cuba. Havana: University of Havana, 2012, digital.
Su dirección email no será publicada. Los campos marcados * son obligatorios.
Normas para comentar:
- Los comentarios deben estar relacionados con el tema propuesto en el artículo.
- Los comentarios deben basarse en el respeto a los criterios.
- No se admitirán ofensas, frases vulgares ni palabras obscenas.
- Nos reservamos el derecho de no publicar los comentarios que incumplan con las normas de este sitio.
